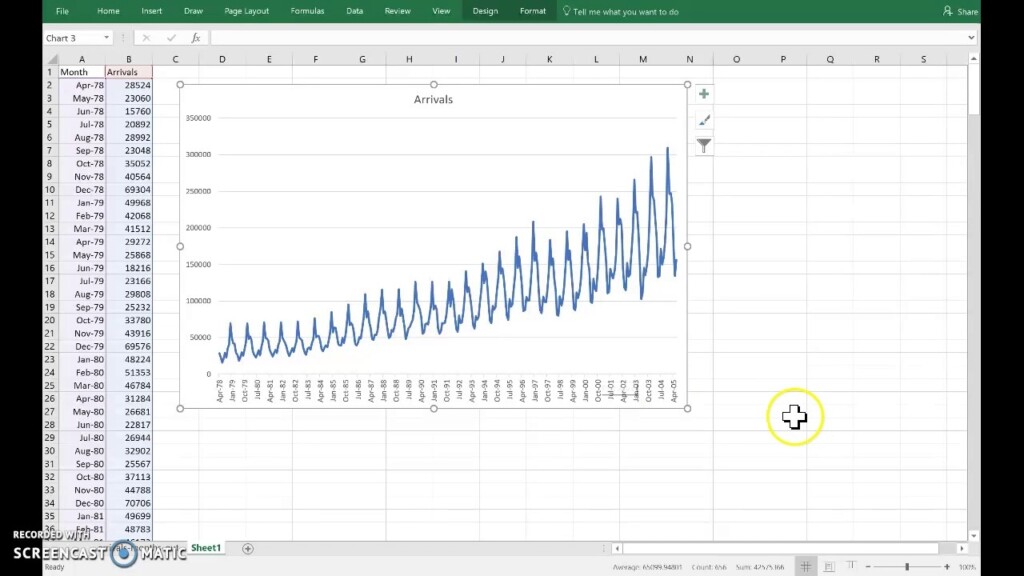
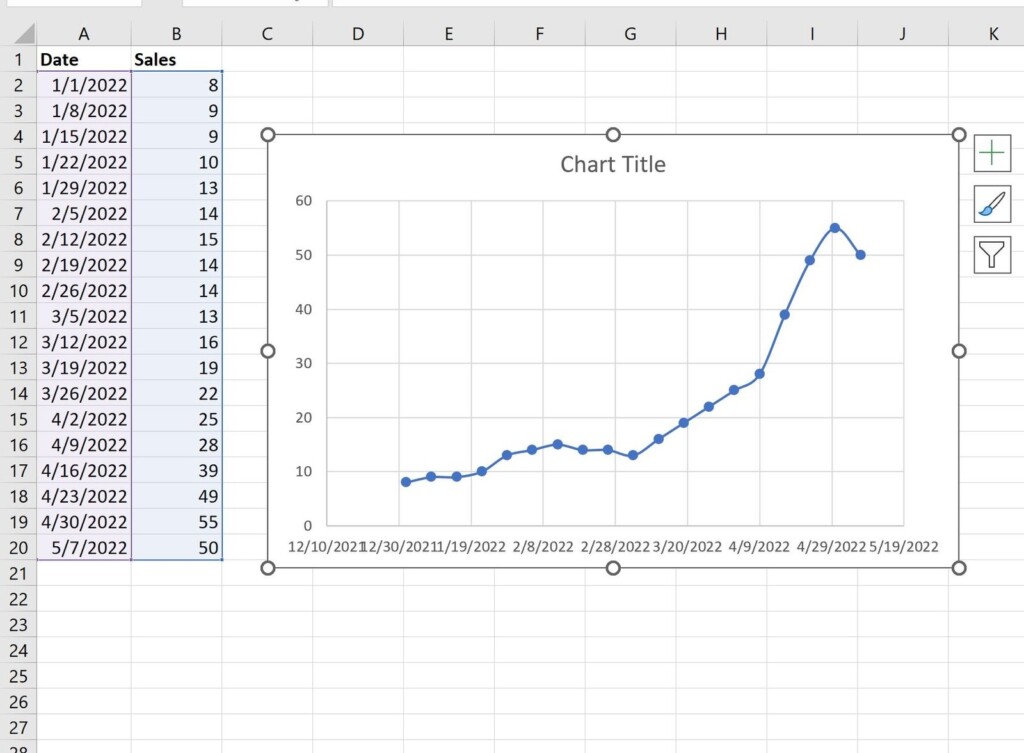
Time series data is a series of data points collected at regular intervals over a specific period of time. In Excel, time series data is typically organized in two columns: one for the time period (e.g., dates or timestamps) and another for the corresponding data values. This type of data is commonly used in various industries such as finance, economics, and sales to analyze trends and patterns over time.
To work with time series data in Excel, it’s essential to format the time period column correctly. Excel recognizes dates and times as serial numbers, with each date counting the number of days since a specific date (usually January 1, 1900). You can format the time period column by selecting the cells, right-clicking, and choosing the desired date or time format from the Format Cells menu.
Creating a Time Series Chart in Excel
To create a time series chart in Excel, follow these steps:
1. Select the time series data range, including both the time period and data values columns.
2. Go to the Insert tab on the Excel ribbon and click on the Line Chart button.
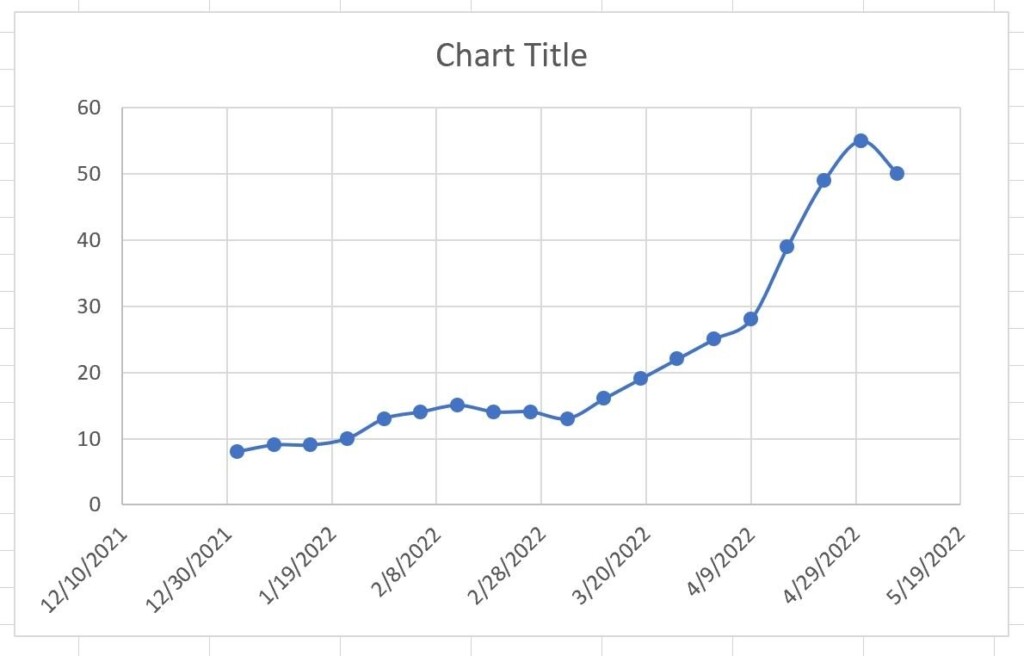
3. Choose the Line with Markers chart type to display data points along with connecting lines.
4. Excel will generate a basic time series chart, which you can customize by adding axis titles, labels, gridlines, and other formatting options.
5. To enhance the chart further, you can add trendlines, error bars, or data labels to highlight key insights in your time series data.
Best Practices for Excel Time Series Charts
When creating time series charts in Excel, it’s essential to follow these best practices:
1. Use clear and descriptive axis labels to provide context for the data being presented.
2. Choose an appropriate chart type (e.g., line chart, scatter plot) based on the nature of your time series data.
3. Avoid cluttering the chart with unnecessary elements and focus on highlighting the key trends and patterns.
By following these guidelines and utilizing Excel’s powerful charting features, you can create informative and visually appealing time series charts to analyze and present your data effectively.
