Times Table Chart 15
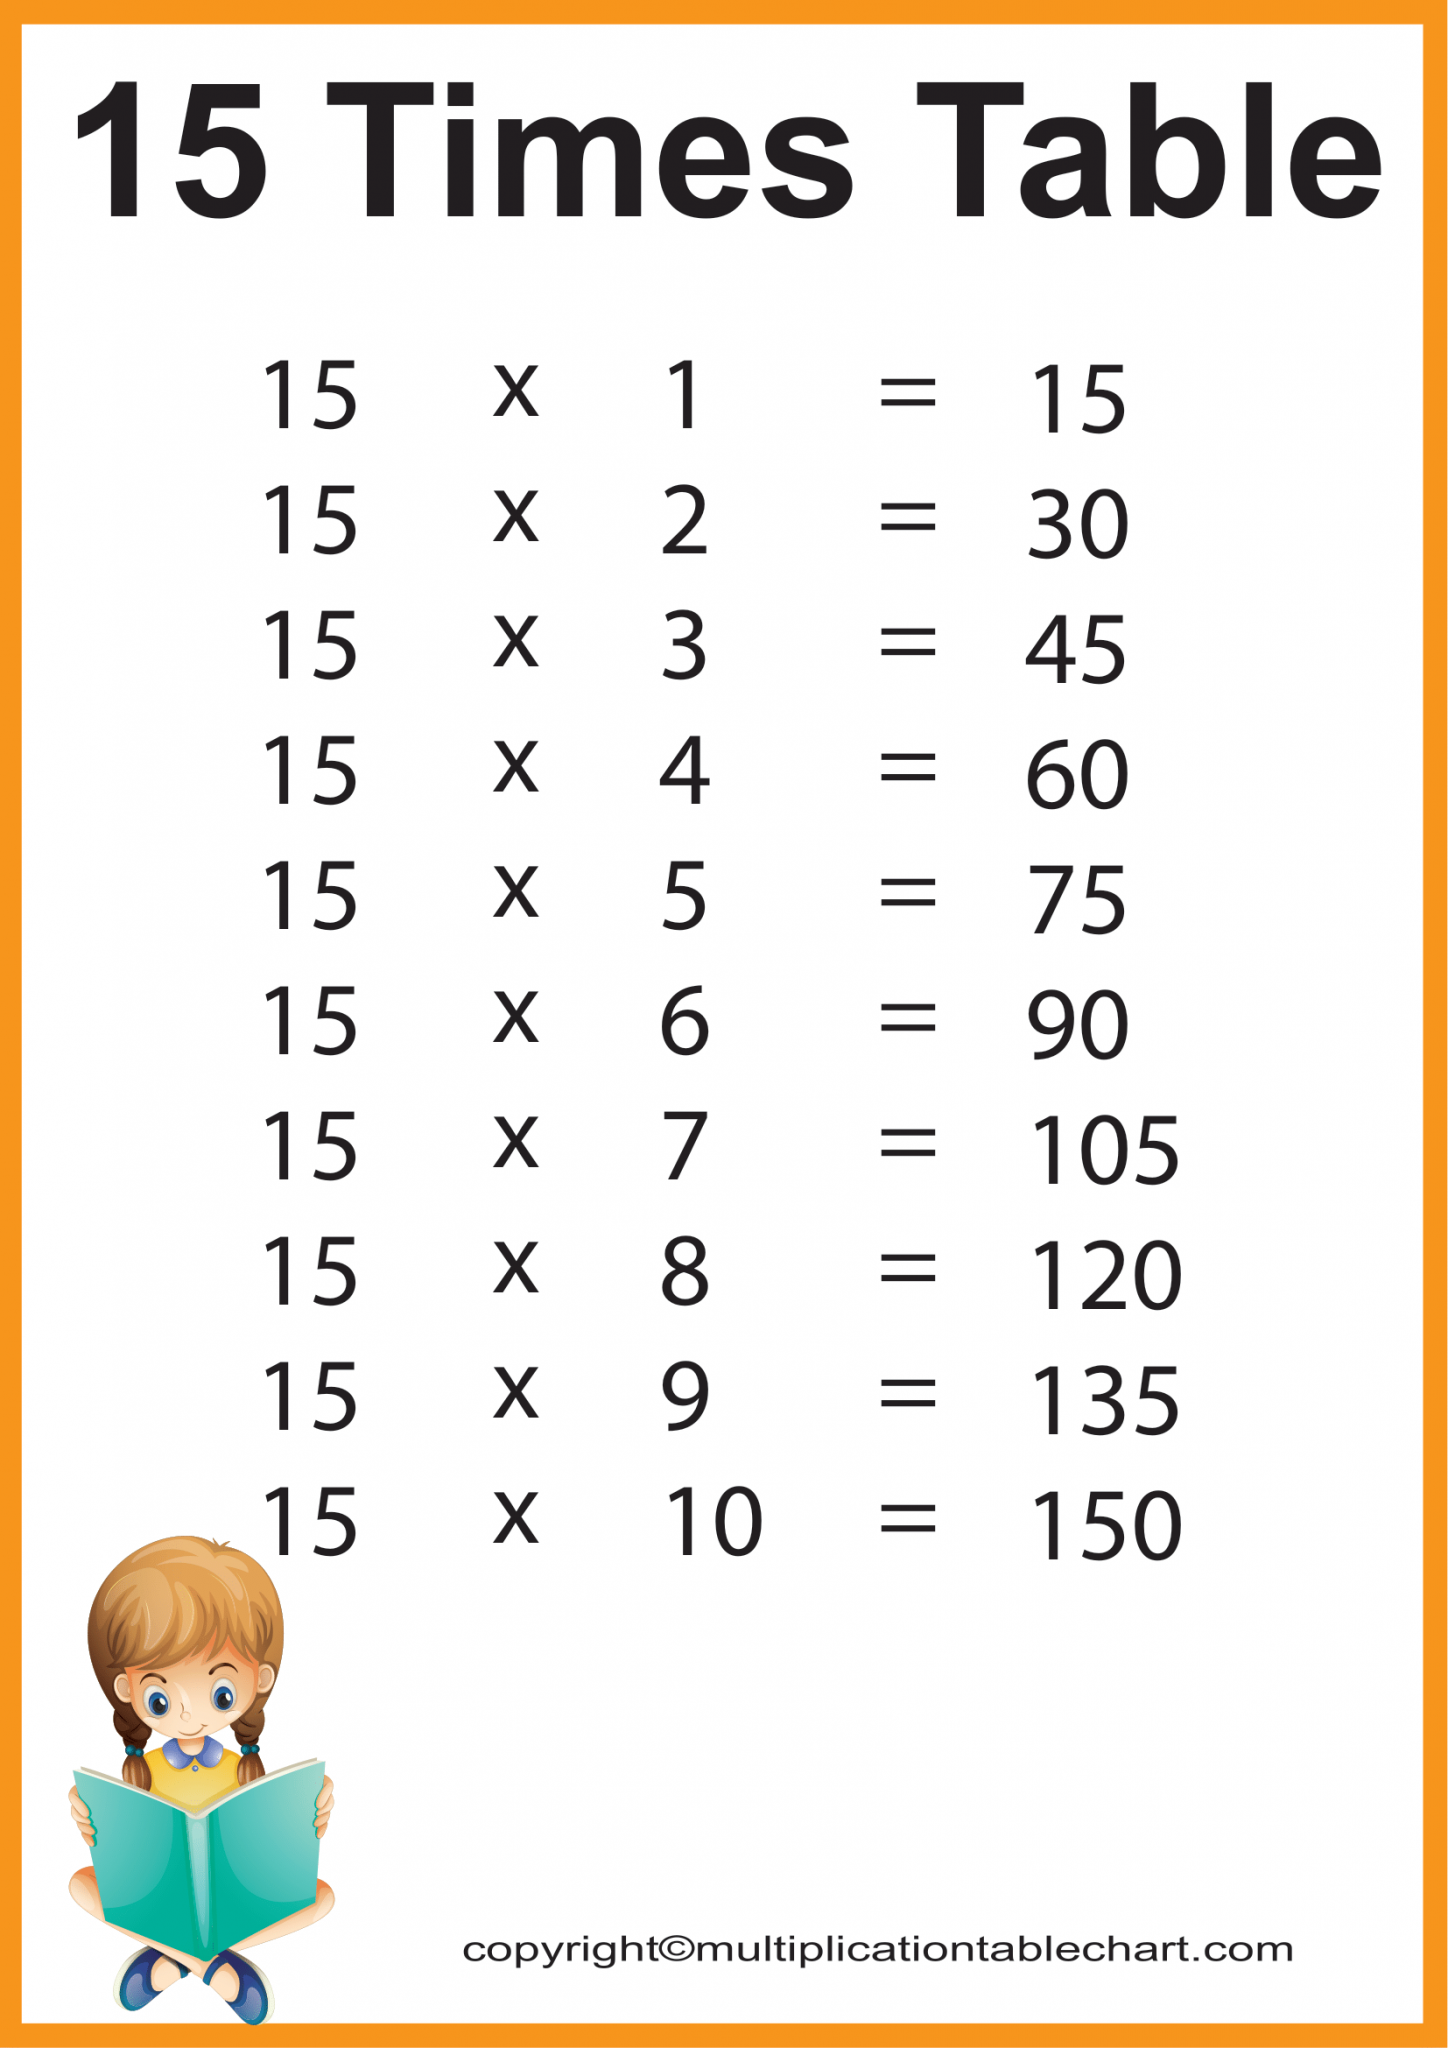
Times tables are an essential part of every child’s education, helping them develop strong mathematical skills that they can carry with them throughout their lives. The Times Table Chart 15 is particularly important as it covers multiplication up to 15, which is a crucial skill for more advanced math topics like algebra and geometry. By … Read more