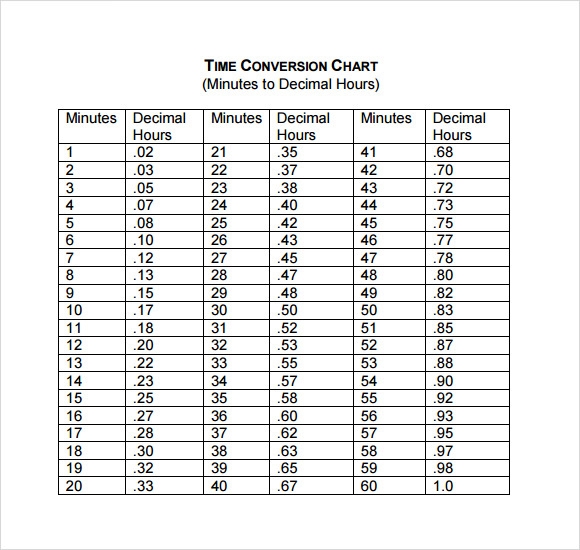
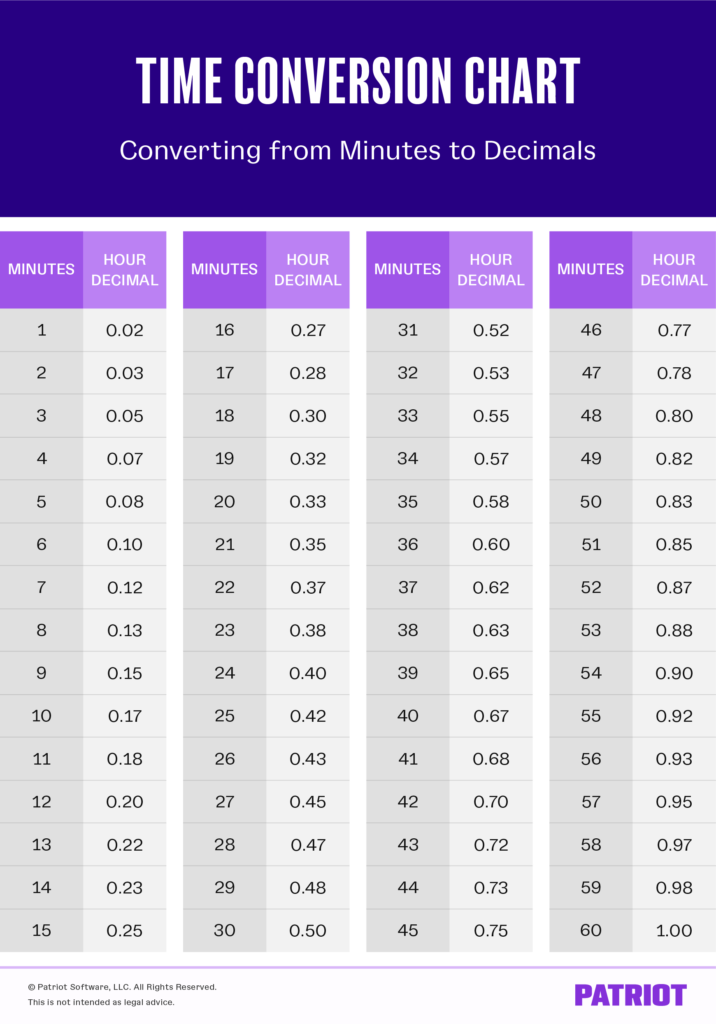
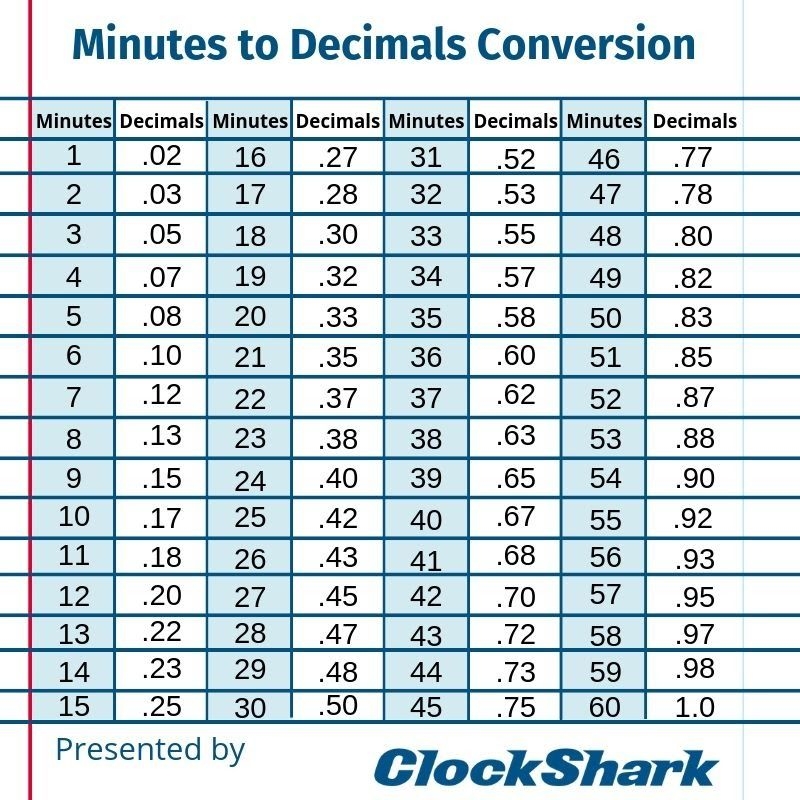
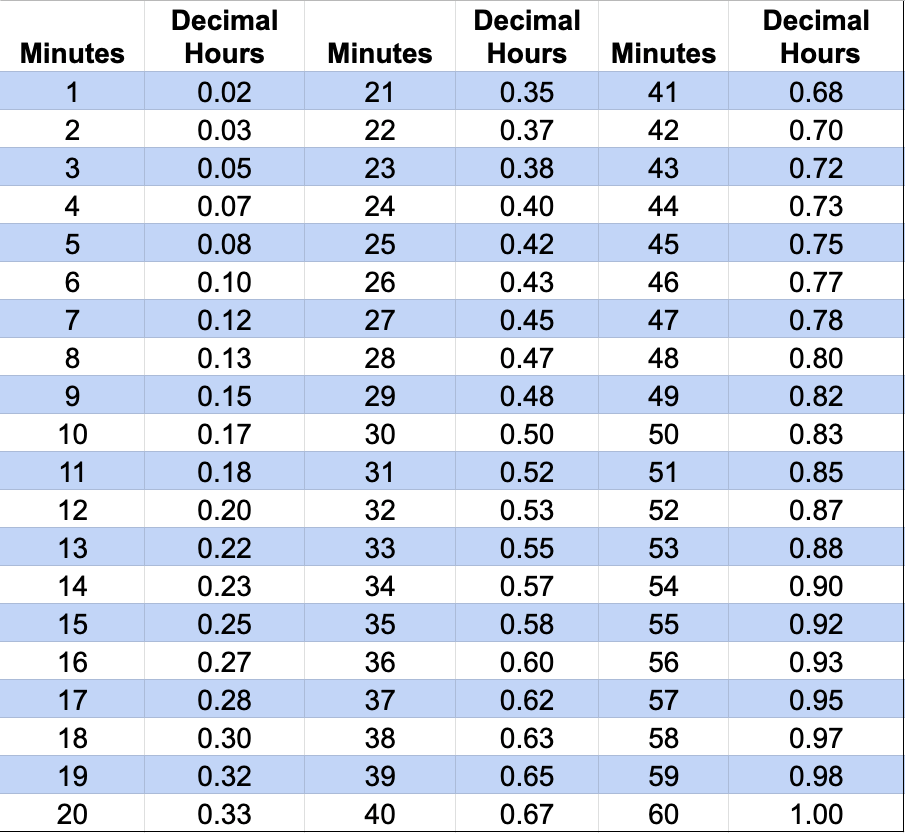
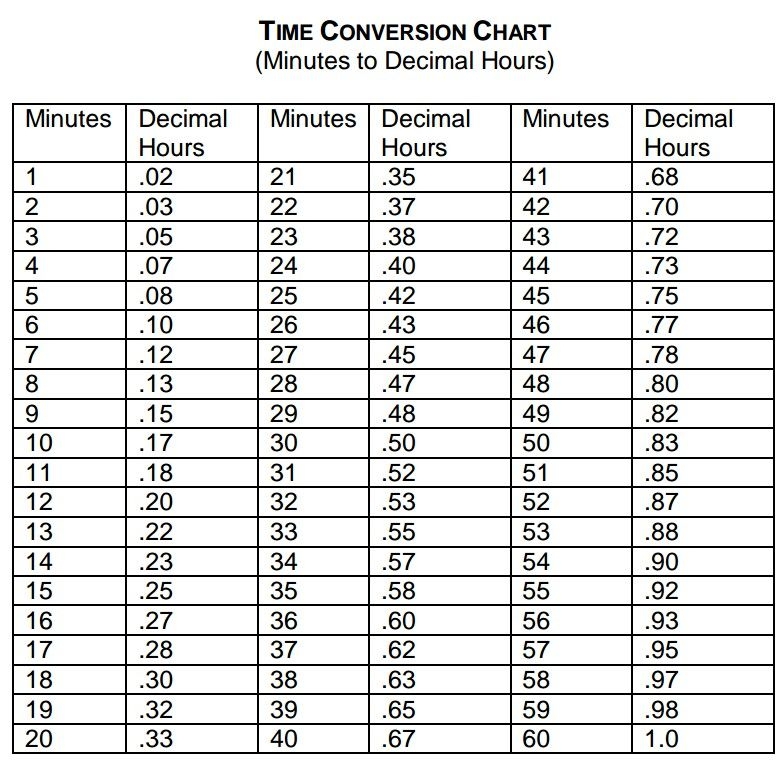
A time in decimals chart is a tool used to convert time from hours and minutes into a decimal format. This conversion is often used in business and industry to simplify calculations and make time tracking more efficient. The chart typically lists common time increments, such as hours and minutes, along with their corresponding decimal equivalents.
For example, instead of writing 1 hour and 30 minutes as “1:30”, it can be represented as 1.5 in decimal form. This makes it easier to add and subtract time values for tasks, projects, or payroll.
How to Use a Time in Decimals Chart
Using a time in decimals chart is simple and straightforward. To convert a time value into decimals, locate the hours and minutes on the chart and find their decimal equivalents. Then, add the two values together to get the total time in decimal form.
For instance, if you have 2 hours and 45 minutes, you can find their decimal equivalents (2 hours = 2.0, 45 minutes = 0.75) and add them together to get 2.75 in decimal form. This makes it easier to calculate total work hours, project durations, or time spent on a task.
Benefits of Using Time in Decimals Chart
There are several benefits to using a time in decimals chart. It simplifies time calculations by converting hours and minutes into a single decimal value, making it easier to perform mathematical operations. It also provides a standardized format for representing time, which can improve accuracy and consistency in time tracking.
Additionally, using decimals can save time and reduce errors compared to traditional time formats. By using a time in decimals chart, businesses and individuals can streamline their time management processes and improve overall efficiency.
