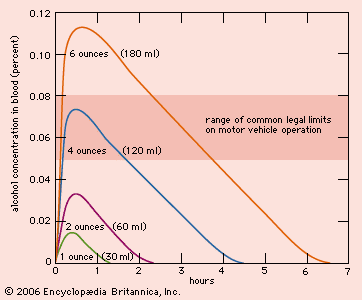
Bac Over Time Chart
A BAC Over Time Chart is a graphical representation of how blood alcohol content (BAC) levels change over a period of time after consuming alcoholic beverages. This chart helps individuals understand how their BAC levels rise and fall based on factors such as the number of drinks consumed, body weight, and time elapsed since drinking. … Read more
