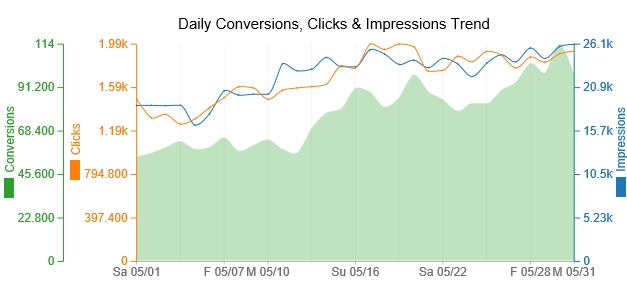
When it comes to visualizing data, choosing the right chart is crucial in effectively communicating trends over time. Whether you’re analyzing sales figures, website traffic, or any other type of data, selecting the best chart can make a significant difference in how easily trends can be identified and understood.
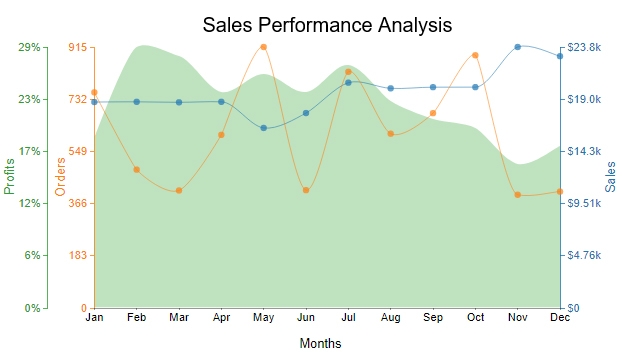
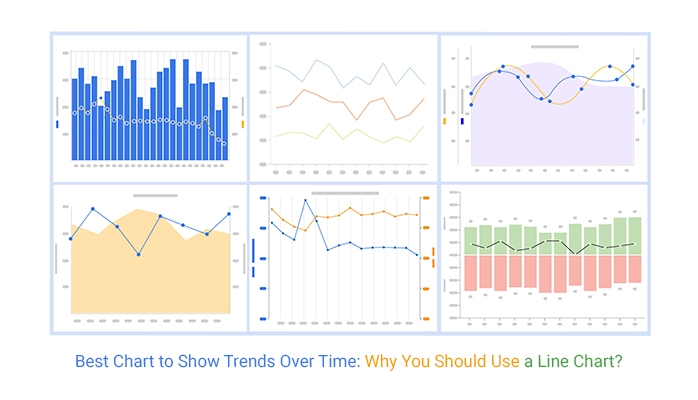
There are several types of charts that can be used to show trends over time, including line charts, bar charts, and area charts. Each type of chart has its own strengths and weaknesses, so it’s important to choose the one that best fits the data you’re working with and the story you want to tell.
Line Charts: A Classic Choice for Showing Trends
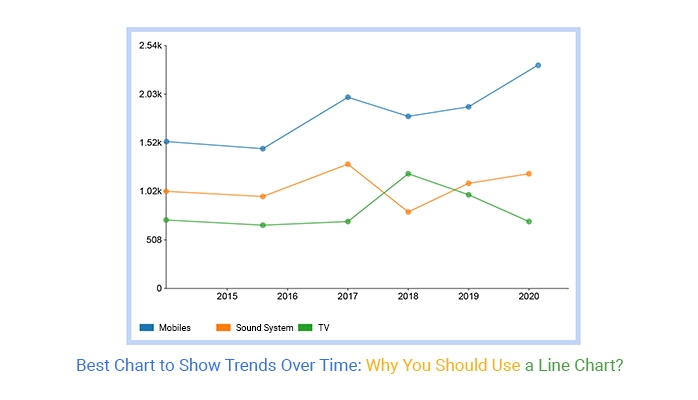
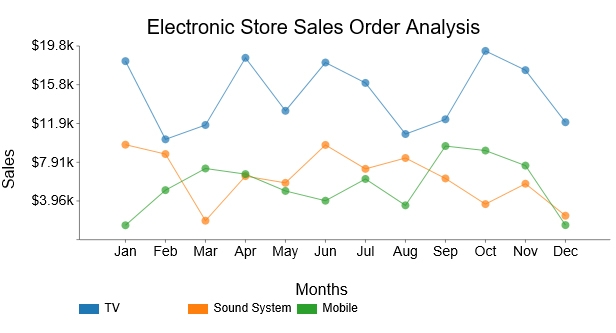
Line charts are a popular choice for showing trends over time because they make it easy to see how a variable changes over a continuous period. The x-axis typically represents time, while the y-axis represents the variable being measured. Line charts are especially useful for showing trends that involve multiple data points over time, allowing viewers to easily see patterns and fluctuations.
When using a line chart to show trends over time, it’s important to ensure that the data is clearly labeled and that the chart is easy to read. Adding annotations or highlighting specific points can also help draw attention to key trends or events.
Bar Charts: A Simple and Effective Way to Compare Trends
Bar charts are another popular choice for showing trends over time, especially when comparing multiple categories or variables. In a bar chart, each bar represents a category or variable, and the height of the bar corresponds to the value being measured. Bar charts are particularly useful for showing changes in data over discrete periods of time, such as monthly sales figures or quarterly performance metrics.
When creating a bar chart to show trends over time, it’s important to choose the right type of bar chart (e.g., vertical or horizontal) and to ensure that the data is presented in a clear and visually appealing way. Adding color-coded bars or annotations can help viewers easily identify trends and make comparisons between different categories or variables.
By choosing the best chart to show trends over time, you can effectively convey complex data in a visually appealing and easy-to-understand way. Whether you opt for a classic line chart or a simple bar chart, selecting the right visualization tool can make all the difference in helping your audience interpret and analyze data trends.
