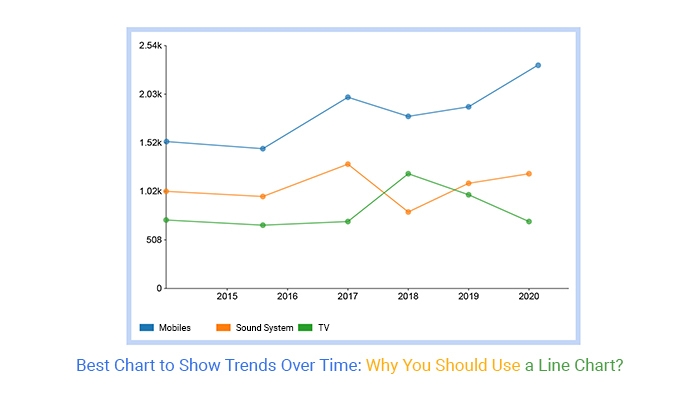
One of the most common chart types used to display trends over time is the line chart. This chart type is effective in showing the progression of data points over a continuous period, making it ideal for visualizing trends and patterns. The x-axis typically represents time, while the y-axis represents the value of the data being plotted. Each data point is connected by a line, allowing viewers to easily track changes over time.
Line charts are versatile and can be used in various industries and settings, such as finance, marketing, and healthcare. They are particularly useful for analyzing sales trends, stock prices, and patient health data. By using a line chart, businesses and organizations can quickly identify patterns, outliers, and correlations in their data.

The Area Chart
Another chart type that displays trends over time is the area chart. Similar to the line chart, the area chart uses a continuous line to connect data points. However, in an area chart, the area below the line is filled with color, creating a visual representation of the data volume. This can be useful for comparing the magnitude of different data sets or illustrating changes in proportions over time.
Area charts are commonly used in visualizing market share, population growth, and budget allocations. They can help highlight trends and patterns that may not be as obvious in a line chart. By utilizing an area chart, businesses can present their data in a visually appealing way that enhances understanding and decision-making.
The Candlestick Chart
A more advanced chart type that displays trends over time is the candlestick chart. This type of chart is often used in financial markets to track the price movements of stocks, currencies, and commodities. Each candlestick represents a specific time period, showing the opening and closing prices, as well as the highest and lowest prices within that period.
Candlestick charts are valuable for identifying market trends, price patterns, and potential reversals. Traders and analysts use these charts to make informed decisions based on historical price data. By analyzing candlestick patterns, investors can gain insights into market sentiment and predict future price movements.