A Times Math Chart, also known as a multiplication chart, is a visual aid used to help students learn and practice multiplication facts. It is a grid that displays all the possible products of two numbers from 1 to 10 or 1 to 12, arranged in a systematic way for easy reference.
Times Math Charts are commonly used in elementary schools to reinforce multiplication skills and build fluency in basic math operations. They can also be a useful tool for parents and tutors to support students in mastering multiplication tables.

How to Use a Times Math Chart
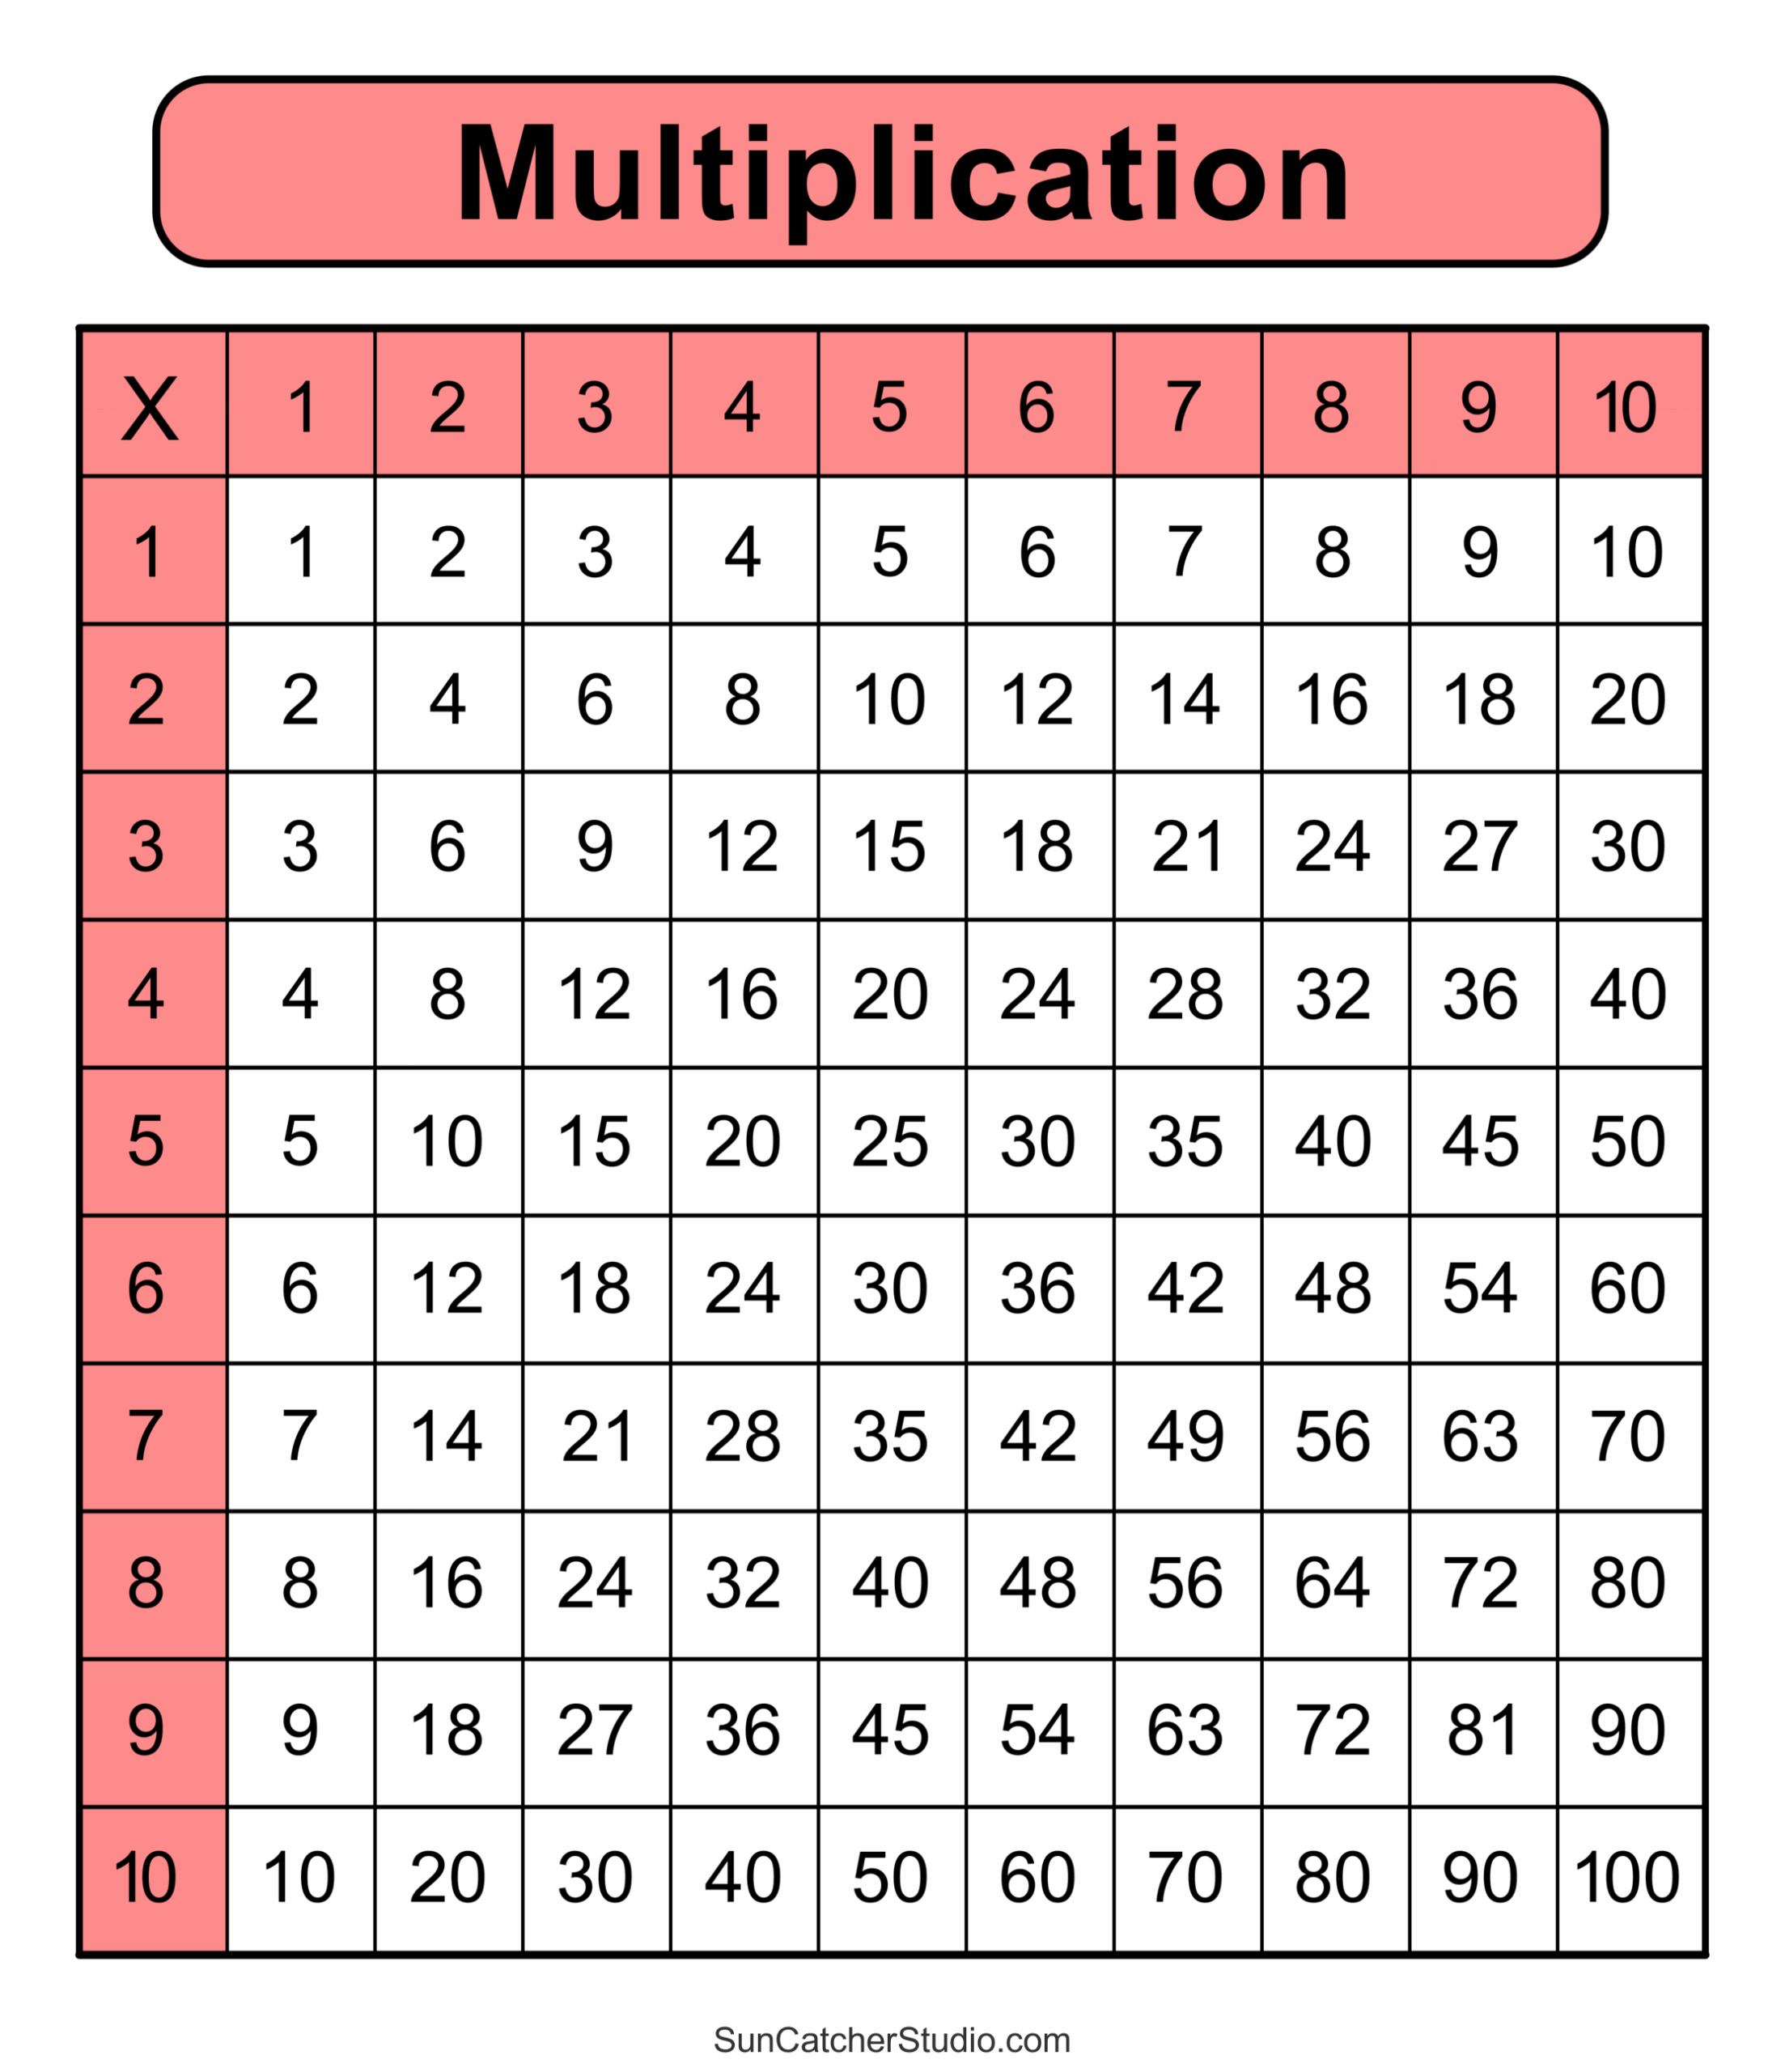
Using a Times Math Chart is simple and effective. To find the product of two numbers, locate the row corresponding to one factor and the column corresponding to the other factor. The cell where the row and column intersect will contain the product of the two numbers.
For example, if you want to find the product of 6 and 8, you would locate the row for 6 and the column for 8 on the Times Math Chart. The cell where the two intersect would show the answer, which is 48.
Benefits of Using a Times Math Chart
Times Math Charts offer several benefits for students learning multiplication. They provide a visual representation of multiplication facts, making it easier for students to see patterns and relationships between numbers. This visual aid can help improve memory retention and recall of multiplication facts.
In addition, Times Math Charts can help students build confidence in their math skills and develop a strong foundation for more advanced math concepts. By practicing with a Times Math Chart regularly, students can become faster and more accurate in solving multiplication problems.